Tuesday, January 27, 2015

Scientific Study: RF Radiation Levels From Celluar Towers


rf radiationThis study presents data related to GSM (Global System for Mobile Communications) cellular phone radiation resulting from antenna sites and towers inside residential areas in Germany. A statistical evaluation of over 200 representative high frequency field measurements is presented for the years 2001 and 2002.


Measurements were conducted at different distances and directions using a frequency selective spectrum analysis to obtain only GSM power densities following the Swiss guideline for GSM cellular phone radiation measurements. Derived from this data, GSM cellular phone tower radiation is dominant in comparison to FM radio or TV emissions. The median power density was found to be in the range of 200 µW/m2 with the maximum level exceeding 100,000 µW/m2. A total of 25 percent of the power densities exceeds 1,000 µW/m2, which has been suggested to be the average threshold value for non-thermal biological effects. Two of the most important factors are the distance and the direct line of sight to the antenna site. At the typical residential cell tower distance of about 250 m in cities, with direct line of sight, the observed levels are in the range of 200 µW/m2.


The results show that, especially for future cellular UMTS (Universal Mobile Telecommunications System) applications, there are several options to minimize additional HF radiation exposures for the population and reduce the potential risk for harmful exposures.


Introduction


The GSM technology of wireless communication produces constant pulsed microwave radiation. The cellular base stations are transmitting continuously even when nobody is using the phone. We know from a variety of scientific studies, that significant biological effects result from the non-thermal effects of extremely periodic – pulsed – HF-radiation as are utilized in the most common modern digital cellular and cordless phone systems in Germany and round the world. Official international and national standards and safety guidelines (based on ICNIRP recommendations) are still only taking into account the risk of thermal effects of high energy HF-radiation.


Most of the official HF public exposure measurements are conducted to observe the percentage of the current standard with only broadband – not frequency selective – measurements. Only in very few cases one or more percent of the (thermal) guideline value is reached or exceeded close to antenna sites. Exposure recommendations based on non-thermal effects are by far lower by many magnitudes. Frequency selective measurements are necessary to observe the cellular base station downlink frequencies and differentiate from other radiation sources as FM radio or TV transmitters. Therefore, very limited information is available on the exposure to cellular base station radiation in residential areas at different distances and directions to antenna sites.
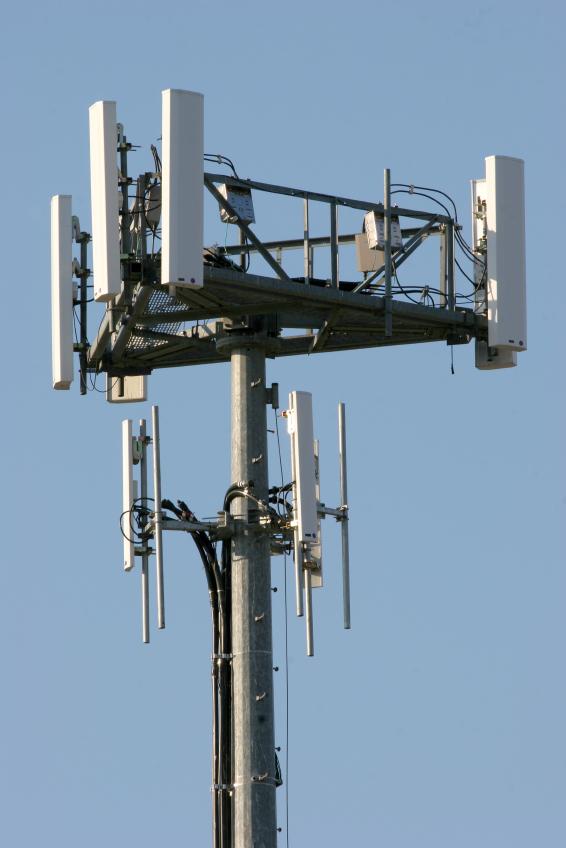

cell tower rf radiation The objective of this field study was to collect measurement data, statistical evaluation, documentation and exposure assessment for cellular phone tower radiation in Germany. Measurements were conducted at different distances and directions, inside and outside of representative public and residential buildings. Frequency selective spectrum analysis was used to obtain GSM power densities following the current recommendations for GSM cellular phone radiation measurements.


Methods and Results


Power density measurements were performed with an Advantest R3131 spectrum analyzer (Rohde & Schwarz) and a calibrated periodic logarithmic log.per. antenna USLP 9143 (Schwarzbeck). The power density measurements were conducted under real-life conditions and only downlink frequencies of the GSM cellular base stations were measured. The antenna was directed in various orientations in order to receive local maximum power densities by peak hold measurements in respect to orientation, polarization, reflection, and interference. For each narrow band region of interest (GSM900, GSM1800) data collection was conducted for 3 x 1 min. scanning time. All measurements were conducted following VDB guideline (VDB 2002) and the Swiss BUWAL guideline (BUWAL 2002). The power density levels are given in µW/m2 (microwatt per square meter). 1 µW/m2 equals 0.1 nW/cm2 (nanowatt per square centimeter). The limit of detection was 0.001 – 0.002 µW/m2 (-70 dBm) per channel power density. The extended error is ± 45 % (BUWAL 2002).


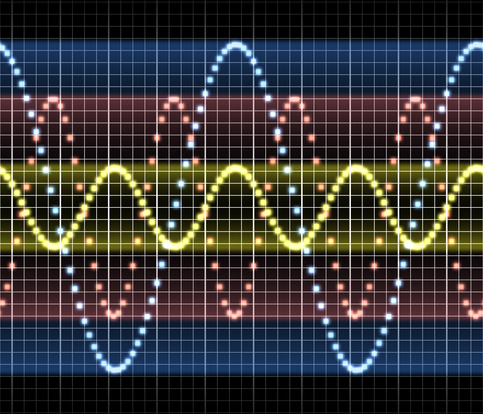
The measurements included a total of 272 locations (132 inside / 140 outside), power densities of all GSM downlink organization channels per location, summation to the maximum possible total power density, and documentation of the distance and the line of sight to the dominating antenna site. Distance profiles were taken for selected locations and different antenna heights and positions. In addition, data for FM radio, TV, DECT cordless phone and other significant HF sources were collected for comparison. Figure 1 shows a typical HF spectrum analysis overview of a location in close vicinity to an antenna site.


Figure 1: HF spectrum analysis – overview
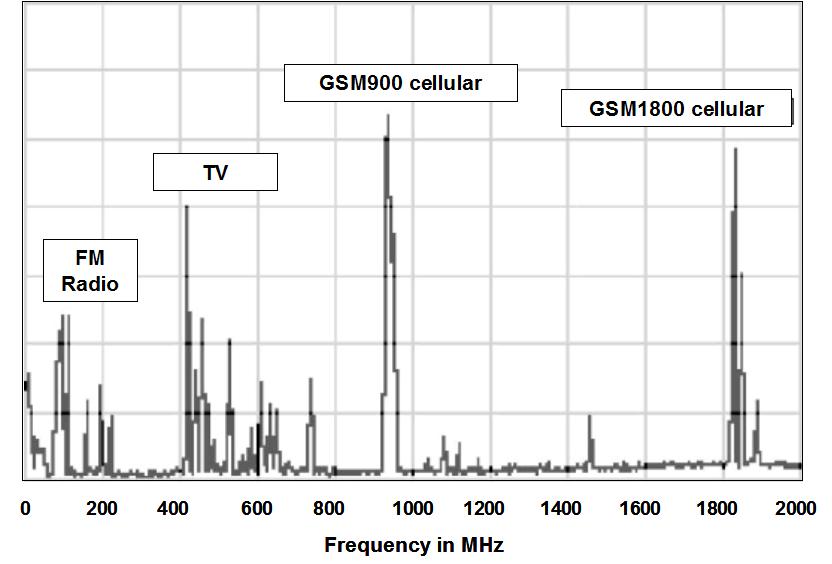

HF spectrum analysis overview


Statistical Data and Percentiles


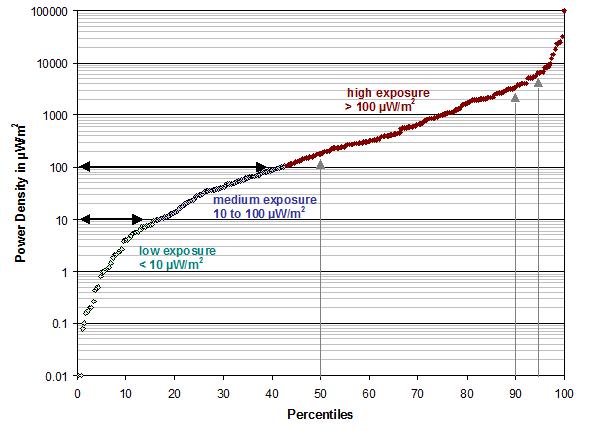
The percentiles for the observed power density values are presented in Table 1. Including all locations, the median distance was 150 meter (450 feet), which is in the range of typical residential distances to GSM base stations in larger cities. The 20th percentile value is 10 µW/m2 and can be considered as residential background GSM radiation level. The 50th percentile value is found at 200 µW/m2 (median). The 95th percentile is observed at 6,300 µW/m2 and can be considered as a significant exposure radiation level. The maximum value of 103,000 µW/m2 was found in a residential building in the 4th floor in line of sight and in the same height to the antenna site at a horizontal distance of 30 meter. In addition, data sets for line of sight, without line of sight, inside and outside locations were calculated separately. (see Table 1 and Figure 2 for further details)


Table 1: GSM cellular tower base station power density levels – percentiles


Figure 2: GSM cellular tower base station power density levels – percentiles

GSM cellular tower base station power density levels


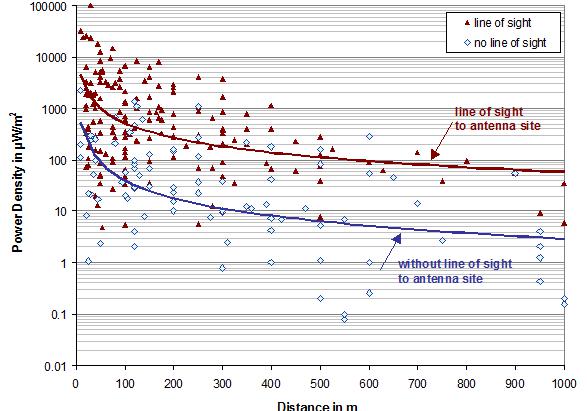
Figure 3: GSM cellular tower base station power density levels – line of sight and distance


GSM cellular tower power density levels


Distance, Line of Sight and Exposure Parameters


The power density values are displayed in Figure 2 in respect to line of sight / without line of sight and the distance to the antenna site. It is obvious, that especially in proximity to the antenna site (< 250 m), the GSM radiation levels are scattering due to various influencing parameters and cannot be calculated easily by using antenna power and distance models only. Table 1 shows a significant systematic difference between the percentile data from line of sight and without line of sight measurements. Figure 2 displays the separated sets of data with trend lines decreasing exponentially to larger distances with lower exposures for without line of sight measurements in the range of 90% reduction (-10 dB). In general, the radiation exposure is predominantly determined by e.g. the following parameters:


  • Distance to the antenna site


  • Line of sight to the antenna site


  • Type of the antennas, e.g. omni directional or directional antennas


  • Number, power, and orientation of the antennas


  • Capacity of the antenna site (number of channels / frequencies)


  • Vertical distance between location and antenna site


  • Type of building construction / type of window glass


  • Total reflection of the environment


Distance and Phone Tower Positions


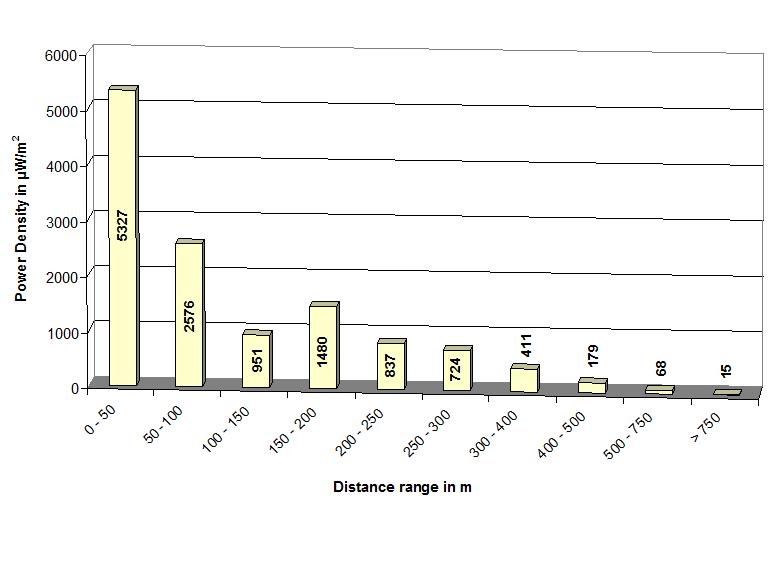
The distance profiles were taken for selected locations and different antenna heights and positions. For high antenna positions (e.g. 50 – 90 m, pole mount position) the maximum power at ground level is reached in about 300 meter and is rather moderate. For low antenna positions (15 – 20 m, typical roof top position) the maximum power at ground level is relatively high and is reached in about 50 meter. Figure 4 shows the average (mean) density values found in distance ranges. We observed no straightforward exponential decrease by distance only. The slight increase in the distance range of 150 – 200 meter (1,480 µW/m2) can be explained by the influence of high antenna positions with maximum values shifted to larger distances.


Figure 4: GSM power density levels and distance ranges


GSM power density levels and distance ranges


Below and Close to Roof Top Positions


Directly below roof top positions (e.g. schools, preschools, homes) significant exposures in the range of a few 1,000 µW/m2 were observed due to secondary side lobes and reflections. During our data collection, the highest exposure values in the range of 10,000 – 100,000 µW/m2 were observed very close to low antenna / roof top positions at inside and outside locations in line of sight and distance < 100 meter.


DECT, TV and FM Radio


The data for FM radio, TV, DECT cordless phone and other significant HF sources show that the GSM cellular phone tower radiation is the dominating HF source in residential areas. DECT signals were detected in 60 inside locations. The maximum DECT power density levels were 0.01 µW/m2 (20th percentile), 1 µW/m2

(50th percentile) and 1,680 µW/m2 (95th percentile). High exposure levels > 1,000 µW/m2 were only detected when the DECT cordless base station was located in the same room or very close to the testing site.


Summary


The results of this study show that the GSM cellular phone tower radiation is the dominating HF source in residential areas in Germany. The median power density is found in the range of 200 µW/m2 (50. percentile) with the maximum value exceeding 100,000 µW/m2. No location reached or exceeded the official standard values for the USA or Germany.


For comparison, thermal (official threshold), other non-thermal (recommendations), and cellular tower exposure reference values are listed in the table 2 below.


Table 2: Comparison of Standard Threshold Values and Recommendations


Total


With

line of sight


Without

line of sight


Outside


Inside


Number of measurements (n)


272


177


95


140


132


Distance in meter (median)


150


100


250


200


100


Power density in µW/m2


Mean


1,800


2,650


130


1,150


2,450


20th percentile


10


70


2


20


10


50th percentile (median)


200


430


20


200


170


70th percentile


640


1,700


70


580


640


90th percentile


3,400


5,200


280


3,260


3,770


95th percentile


6,300


8,500


610


6,490


5,330


99th percentile


23,000


25,000


1,340


12,350


32,000


Maximum


103,000


103,000


2,200


14,400


103,000


Therefore, in respect to recent studies and review of articles regarding non-thermal biological effect of e.g. digital pulsed GSM radiation, the stoa study concluded with a considerable concern revealing a need clear need for radio frequency safety. For example, 25 % of the locations the long term exposure levels are very high above 1,000 µW/m2, which has been suggested to be the average threshold value for non-thermal biological effects. These levels are reached especially in proximity of the antenna sites, directly below antenna sites and in line of sight in a distance of < 250 m. Two of the most important limiting factors are the distance and the direct line-of-sight to the antenna site. But, in proximity to the antenna site, the GSM radiation levels are scattered due to various influencing parameters and cannot be calculated easily by using antenna power and distance models only. In general, exposures for without line of sight locations are about 90% (-10 dB) lower than those for line of sight.


In comparison to recommendations for exposure assessment (OEKOTEST 2001), the statistical data evaluation is the following (see figure 2):


  • 20 % of data in the range of low exposure below 10 µW/m2 (20th percentile, background level)


  • 25 % of data in the range of medium exposure between 10 – 100 µW/m2


  • 55 % of data in the range of high exposure above 100 µW/m2


Very few measurement data are in the range of extreme exposure 10,000 µW/m2to 100,000 µW/m2.


Conclusions


As long as the only basis for official standards for high frequency radiation are thermal effects and heating of the body tissue (ICNIRP, ANSI, IEEE, NCRP, FCC, SSK, WHO) there is no need for the industry to invest into less emitting and saver products. More and more scientists state that the view of energy absorption only is insufficient to describe the possible rf radiation effects on human health. Potential biological effects need to be considered due to


  1. Non-thermal or low intensity levels of HF radiation,


  2. Chronic versus acute exposure and,


  3. Pulsed HF radiation, which is reported to be more bioactive than constant wave RF radiation.


The human body reacts more complexly than acknowledged in the thermal model and is sensitive to extreme periodic stimuli. The biological system takes the “energy” as well as the “information” which is brought by the continuous pulsed modulation pattern. Much experimental evidence of non-thermal influences of microwave radiation on living systems have been published in the scientific literature during the last 30 years – relating both to in vitro and in vivo studies – and were reviewed just recently by the STOA commission for the European Parliament (STOA 2001). From the use of microwave wireless technologies e.g. the following non-thermal biological effects have been reported:


  • Changes in the electrical activity in the human brain (von Klitzing 1995)


  • Increase in DNA single and double strand breaks from RF exposure to 2.45 GHz (Lai & Singh 1996)


  • Increased lymphoma rates (2 fold) in transgenic mice exposed twice a day exposed to 30 minutes of cell phone (GSM) signals over 18 month (Repacholi 1997)


  • Increased permeability of the blood-brain barrier in rats (Persson 1997)


  • Production of heat shock proteins and cancer risk (French 2001)


  • Higher risk of uveal melanoma (Stang 2001)


Other reported effects include e.g. (STOA 2001):


  • Observation of an increase in resting blood pressure during exposure,


  • Increased permeability of the erythrocyte membrane,


  • Effects on brain electrochemistry (calcium efflux),


  • Increase of chromosome aberrations and micronuclei in human blood lymphocytes,


  • Synergistic effects with cancer promoting drugs and certain psychoactive drugs,


  • Depression of chicken immune systems,


  • Increase in chick embryo mortality,


  • Effects on brain dopamine/opiate electrochemistry,


  • Increases in DNA single and double strand breaks in rat brain,


  • Stressful effects in healthy and tumor bearing mice,


  • Neurogenetic effects and micronuclei formation in peritoneal macrophage.


In this review study, a threshold of 1,000 µW/m2 was pointed out for non-thermal biological effects. For locations with any long-term exposure, a further safety factor of 10 was recommended for pulsed cellular phone radiation sources as cellular phone base stations. In this case, the power densities should not exceed 100 µW/m2. Although, the power density of the radiation used in these experiments is typically found in the head area when using a cellular phone, the information content of the radiation emitted by the latter is the same; accordingly, these results are not irrelevant to the consideration of potential adverse health effects associated with chronic exposure to cellular or cordless base-station radiation.


From the scientific point of view, adverse human heath effects of non-thermal radiation levels cannot be exactly quantified, verified, or excluded at this time. Only limited toxicological information is available in respect to the widespread use and the economical impact of the cellular phone systems in industrial nations. On one side, there is always a demand for scientific proof for human adverse health effects and dose response when establishing official economically reasonable guideline exposure threshold values. On the other side, insufficient limit of detection, insufficient dosimetry and exposure control, and industry friendly research bias the risk assessment for long-term adverse health effects, especially in the field of the cellular phone industry. That makes it clear – that by definition – official guideline standard values can only limit the consequences of adverse health effects in the frame of the economical impact.


Recommendations


We recommend to follow the principle of prevention. This includes implementation of residential exposure minimization and prevention procedures in the frame of the technical feasibility as long as the non-thermal effects are not considered in any official standard and guideline. These will include especially sensitive locations as preschools, schools, hospitals, and residential areas. So far, no other technical aspects than interferences, system coverage and system performance are taken into account.


By official definition, the cellular phone system covers an area when the signal strength of about 0.001 µW/m2 is reached. We expect that with little effort, cities, communities, and the providers will be able to significantly reduce the long term rf radiation exposures to cellular phone towers in residential areas.


Read Additional EMF RF Articles:


If you have concerns about your home, building, school, or any other structure that is close to cell tower, call the experts at EMFRF Solutions to have your location tests and advice on how to properly shield from the radio waves. Call 760-942-9400 Today!


HF-Radiation Levels of GSM Cellular Phone Towers in Residential Areas


Thomas Haumann1, Uwe Münzenberg2, Wolfgang Maes3
AND Peter Sierck4


1Umweltanalytik und Baubiologie, Meisenburgstrasse 25, D-45133 Essen, Germany


2AnBUS e.V., Mathildenstrasse 48, D-90762 Fürth, Germany


3Baubiologie Maes, Schorlemerstr. 87, D-41464 Neuss, Germany


4Environmental Testing & Technology, Inc., 1106 Second Street, Encinitas CA 92024, USA


References

BUWAL 2002 Schweizer Messvorschrift für GSM-Sender 2002, BUWAL – Bundesamt für Umwelt, Wald und Landschaft. (www.buwal.ch)


Ecolog 2000 Hennies K., Neitzke H.-P. & Voigt H., Mobilfunk und Gesundheit – Bewertung des wissenschaftlichen Erkenntnisstandes unter dem Gesichtspunkt des vorsorgenden Gesundheitsschutzes. Im Auftrag der T-Mobil. Hannover, April 2000 (ECOLOG-Institut für sozial-ökologische Forschung und Bildung, Nieschlagstr. 26, D-30449 Hannover, Germany)


French 2001 French P. W., Penny R., Laurence J. A. & McKenzie D. R. , Mobile phones, heat shock proteins and cancer. Differentiation 2001, 67 (4-5), pp. 93-97.


Lai & Singh 1996 Lai H. and Singh N.P. Single and double-strand DNA breaks after acute exposure to radiofrequency radiation. Int. J. Radiation Biol. 1996; 69: 13-521. See also: Singh N.P. and Lai H. Use of the microgel electrophoresis assay to study DNA strand breaks after microwave exposure. Proc. Asia Pacific Microwave Conf. (Editor: R.S. Gupta) 1996, Vol. 1 (B1-4), pp.51-55.


MAES 2000 Maes W., Stress durch Strom und Strahlung, 4th ed. 2000, Verlag Institut für Baubiologie und Oekologie IBN, Neubeuern, Germany.


OekoTest 2001 Test “Mobilfunk-Sendeanlagen”, Öko-Test 4/2001 Germany, April 2001, pp. 32 – 40. (www.oekotest.de)


PERSSON 1997 Persson B.R.R. et al., Blood-brain barrier permeability in rats exposed to electromagnetic fields used in wireless communication, Wireless Networks 1997; 3: pp. 455-461.


Repacholi 1997 Repacholi M.H. et al. Lymphomas in E µ-Pim 1 transgenic mice exposed to pulsed 900 MHz electromagnetic fields. Radiation Res. 1997; Vol 147, pp. 631-640.


Resolution 2000 Salzburg Resolution on Mobile Telecommunication Base Stations – International Conference on Cell Tower Siting, Linking Science & Public Health, Salzburg, Austria, June 7-8, 2000. (www.land-sbg.gv.at/celltower)


SBM 2000 Baubiologie Maes and IBN, Standard der Baubiologischen Messtechnik SBM 2000, Richtwerte für Schlafbereiche, in “Stress durch Strom und Strahlung”, Maes W., 4th ed. 2000, pp. 542 – 545, Verlag Institut für Baubiologie und Oekologie IBN, Neubeuern, Germany. (www.maes.de)


Stang 2001 Stang A., Anastassiou G., Ahrens W., Bromen K., Bornfeld N., and Jöckel K.H., “The possible role of radio-frequency radiation in the development of uveal melanoma” in: Epidemiology 2001, Vol, 12, pp. 7-12.


STOA 2001 THE PHYSIOLOGICAL AND ENVIRONMENTAL EFFECTS OF NON-IONISING ELECTROMAGNETIC RADIATION, STOA – Scientific and Technological Options Assessment, Options Brief and Executive Summary, PE Nr. 297.574 March 2001, (www.europarl.eu.int/stoa/publi/pdf/00-07-03_en.pdf)


VDB 2002 VDB-Richtlinie, Teil II A 3, draft 2002, Verband Deutscher Baubiologen e.V. (www.baubiologie.net)


von Klitzing 1995 von Klitzing L. “Low-Frequency pulsed electromagnetic fields influence EEG of man.” Physica Medica, Vol. 11, No. 2, 77-80, April-June 1995, see also von Klitzing, L. in “Elektrosmog – Wohngifte – Pilze, Baubiologie – praktische Hilfe für jedermann”, Maes W., 1st Ed.1999, Haug-Verlag, Heidelberg, Germany.


Read the full story at: http://www.emfrf.com/rf-radiation-levels-from-celluar-towers/

Comparison of Standard Threshold Values and Recommendations

(electromagnetic fields, non ionizing radiation)


Total Power Density


Standards, GSM1800/GSM1900/UMTS/DECT (e.g.)


FCC/ANSI – USA


10,000,000 µW/m2


Germany, England, Finland and Japan


10,000,000 µW/m2


Belgium


1,200,000 µW/m2


Switzerland and Italy


90,000 µW/m2


Recommendations / References (e.g.)


Ecolog Study, Germany (Ecolog 2000)


10,000 µW/m2


Cellular tower radiation – significant exposure level, 95th percentile (this study)


6,300 µW/m2


Salzburg, Austria (Resolution 2000)


1,000 µW/m2


Cellular tower radiation – median level, 50th percentile (this study)


200 µW/m2


High exposure, Oeko-Test (OekoTest 2001)


100 µW/m2


EU Parliament (STOA 2001)


100 µW/m2


Cellular tower radiation – background level, 20th percentile (this study)


10 µW/m2


Low exposure, Oeko-Test (Oeko Test 2001)


10 µW/m2


Nighttime exposure, Baubiology Standard (SBM 2000)


0.1 µW/m2


Successful communication with GSM mobile phone, system coverage requirements


0.001 µW/m2


Natural cosmic microwave radiation (Maes 2000)


0.000001 µW/m2


No comments:

Post a Comment