 If you want to measure RF emissions from smart meters, we have developed smart meter measurement protocol in conjunction with Health Living Technologies. It provides a step-by step protocol for using a Gigahertz Solutions HF59B meter in conjunction with the NFA1000 data logger.
Introduction
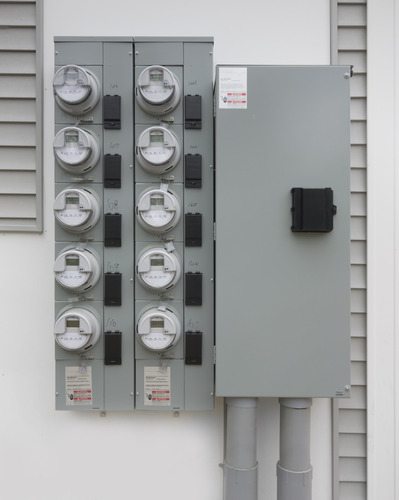
Smart Meters are utility meters that transmit user data wirelessly via repeater stations to utility companies. These new meters are replacing the traditional electric, water and gas utility meters in order to tracking energy consumption electronically and remotely. Smart meters are currently installed throughout different states in the United States and in Canada. The Smart Meters relay consumption data back to the power utility companies, at various time intervals throughout the day. The primary method of sending this information back to the utility company is via radio frequency (RF) waves. Concerns about potential health effects from the radio frequency exposure from smart meters have been raised by individuals, scientists and organizations.
The Purpose
The purpose of this document is to provide a complementary measurement methodology for smart meter RF emissions. Traditional standard compliance measurements record the radiated power in 6 minute time averages. However, smart meter transmit only for milliseconds at a time and averaging will result in significantly lower values and may not depict the appropriate exposures level.
The instrumentation and methodology described in this protocol were developed after a pilot study with different RF instruments was utilized. It was noted that not all instruments were capable of providing the various aspects of measurement data required. The test results and measurement challenges have been described in a previously published technical paper entitled Smart Meter – What do we Know? The document can be downloaded at http://etandt.com/documents/SmartMeter-WhatWeKnow.pdf
Our goal was to utilize relatively cost efficient professional instrumentation, yet provides reliable, reproducible information on the radiated signal amplitude (power output), frequencies and rate of transmission (duty cycle). The authors of this guideline document are looking for input to improve the protocol and to add other instrumentation which fulfills the requirements.
Characteristic of Smart Meter Signals
Wireless Smart Meters receive and transmit data using a wireless network. The transmission occurs with a dipole antenna. These frequencies are similar to frequencies used in cellular phones, wireless computer networks, DECT cordless phones, baby monitors, Wi-Fi systems, and other wireless networks and devices. Smart meters use a technology, which is referred to as frequency hopping spread spectrum. That means the transmission frequency will change constantly during a given time period. Two or three different frequency bands are currently being utilized.
902-928 MHz (megahertz) band is mostly used for transmission to repeater units.
1.9 GHz (gigahertz) band can potentially be used for transmission to repeater units.
2.4 GHz band for future communication of appliance data via ZigBee or Wi-Fi network and in the transmission to the cellular network band.
The RF output from the meters is unique as information is transmitted in quick bursts lasting only milliseconds (ms) in time. Transmissions come in bursts with rates as often as every few seconds to once per hour, and can vary in frequency. The question is how do we measure them?
Measurement Challenges
Characterizing RF fields produced by Smart Meters can be difficult. The intermittent nature of the emissions means that it is not a simple matter of bringing an instrument to an installed meter and be able to instantly detect the presence of the various emissions. The smart meter may or may not be in a transmit mode at the time when measurements are sought. Further, the spread spectrum characteristic (frequency hopping) of the emissions leads to a further complication.
For example, the emitted signal, at any particular instant in time, may be on any specific frequency within the 902 to 928 MHz band. When using narrow-band instrumentation, such as a frequency swept spectrum analyzer, the challenge is to have the analyzer on the specific frequency at the very instant in time that the emission is occurring to be able to measure its signal strength (amplitude). Since the emissions are highly intermittent, this may take considerable time to insure that any such emissions have been captured by the instrumentation. These transmission rates are referred to as duty cycles. A 100% duty cycle corresponds to continuous operation, e.g. 24 hours/day. A 1% duty cycle corresponds to a transmitter operation of 1% per 24 hours.
Instrumentation and Methodology
These suggested measurement protocols use commonly available low cost professional RF instrumentation to assess the signal strength, time interval of transmission bursts and determination of the 900 MHz frequencies. We have found this instrument set-up to be successful in providing a good overview of the emission parameters. Improvement to the initial protocol can be made. Submission of suggestions from other parties is encouraged. The instrumentation used includes a broadband RF power meter to measure power density of output signals, a data logger to record RF power output and rate of transmission bursts, RF analysis software and a laptop computer.
Preliminary Set Up Selection
The first and most important step is the determination of the appropriate measuring range setting for the instrument. The instrument has three different power density range settings. See table below.
Setting | Power Density Range | ||
Maximum (coarse) | 200 – 20,000 µW/m2 | ||
Medium (medium) | 20 – 200 µW/m2 | ||
Minimum (fine) | 0 – 20 µW/m2 | ||
 Before data logging begins, measurements with the HF59B should be conducted to determine the level of background RF radiation present. This will determine the best measurement range for logging the Smart Meter transmissions.
Meter Switches | Switch Setting |
Range | Max (20,000 µW/m2) |
Video Bandwidth | VBW” – Standard |
| Signal Type | Full |
| Signal | Peak Hold |
| External Adapter | 0 dB |
| Volume | Medium |
- Turn unit on. Hold or place the instrumentation approximately 2-3 feet horizontally from the Smart Meter to be tested and wait. When a transmission burst is detected an audible signal will occur. Record the value on the LCD display. Clear the display by depressing the clear button for 3-5 seconds. Repeat this procedure until 2-3 consistent readings have occurred and have been recorded. This process will provide an indication of what signal strength levels are expected during the data logging process.
- If readings are:
Greater than 20,000 µW/m²
Below 200 µW/m
Below 20 µW/m
A vertical bar, without any other values, will be displayed on the left side of the LCD display. This means that the signal strength was above the measurement range. If this is the case, attach the external attenuator (DG20_G3) to increase the power range and set the External Adapter Switch to the -20 dB setting. Repeat the previous procedure.
Switch the measurement scale to Medium and repeat the previous procedure.
Switch the measurement scale to Minimum and repeat the previous procedure.
Instrument Set Up
- Connect the UBB27 isotropic probe to the HF59B RF power meter by inserting the probe into the front of the instrument and attaching the probe cable to the antenna input port.
- Connect the NFA1000 to the HF59B RF power meter with a 2.5mm interface cable. Insert the cable into the DC output port of the HF59B and the AC/DC input port of the NFA1000.
- Configure the HF59B and the NFA1000 as follows:
HF59B
NFA1000
Switches
Setting
Meter Switches
Switch Setting
Range
Max
Mode
Auto
Signal
Peak
Signal
TRMS
DC Output
1
Field Selection
M3D
VBW
Standard
Memory
SD memory card installed
Signal Type
Full
External Adapter
0 dB
Volume
Low to conserve power
Power
Battery mode will last approximately 2 to 3 hours
Power
Battery mode will last approximately 36 hours
- If long term data logging is required (more than 2 hours) use the provided AC adapter and ensure ferrite beads are installed on the power adapter of NFA1000 as well as the HF59B.
- Ensure that all nearby wireless devices are unplugged or turned off, such as cordless telephones, wireless internet routers and cell phones. Any active wireless devices near the testing area can significantly impact the smart meter measurement results.
- Take the unit to the measurement location.
- Attach the HFE59B with the probe to a tripod or a pedestal providing the right positioning for the measurement location. The NFA1000 should be located several feet away, below the HF59B. The tripod or supporting device should be non-metallic, if possible.
- Place the HF59B horizontally at a minimum distance of 2 to 3 feet from the smart meter. This assures that the instruments are in the far field region. The 900 MHz range has a wave length of 33 centimetres. The far field starts at 2-3 wave length.
- Power HFE59B on, by sliding the power switch to the top position. Check to see that the display is iluminated.
- Power the NFA1000 on, by turning the power switch in the “log” position.
- Make sure that the HF59B display shows numeric values. The NFA display will cycle through 3 different sets of information. The Log#, the length of the current log and the remaining battery life. Record the Log# displayed in your field notes. The log# on the meter will be displayed as L052 meaning log # 052. The recorded data is stored in the NFA1000 SD memory card with the current log file number. Eg. LOG00052.TXT
- Let the configured instruments run until the measurement time period is completed. Allow the testing to run for several hours – the longer the better.
- When testing is complete, power off the NFA1000 first by switching the power button form the Log position to the off position. After a few seconds power off the HF59B by switching the power button to the off position.
- Take instrument assembly apart, store in cases.
Data Analysis by Software
- Connect the NFA1000 via a USB port and cable to a PC. One can also remove the SD memory card and insert it directly into a card reader of a computer. The SD card will appear as a removable hard drive. Always remember to eject the SD card properly as any other USB device to avoid loss of data.
- Run NFAsoft.140.exe, or later version, from the PC, or the SD memory card of the NFA1000.
- Click the analyze data button


- The following screen will appear
- Select the appropriate Log File and click open.
- The following screen will appear.
Channel 4 by clicking the arrow to the left of its title.

- If another channel is open, it can be closed by clicking the arrow to the left of the channel title.
- Units of measurement for Chanel 4 is milliVolts “mV”.
- When logging, the recorded data is saved on channel 4 and the unit of measurement is in milliVolt (mV). This data needs to be converted to a power density reading in µW/m².
- Right click on Channel 4. A dropdown menu will appear.
- Click “Select HF Unit”
- An HF unit conversion Box will appear.

- Click the down arrow on the dropdown menu to reveal conversion options
- Select the measurement range used for logging
For Example:
Range
Selection
Max.
20.00mW/m2 or 20,000µW/m²
Med.
200.00µW/m²
Min.
20.00 000µW/m²
- Select 1 V DC output (Default).
- Click okay to complete data conversion.
- A new HF window will now appear in red displaying the converted data in Power Density in µW/m²

- Close Channel 4 by clicking on its down arrow to allow only your logged data to be visible. This is what you should see.
- y-axis – Power Density in µW/m²
- x-axis – Recorder Data plotted in µW/m²
Measurement Uncertainty
Every measurement is subject to uncertainties. Any official measurement report can only be considered to be complete when it includes the measurement uncertainties as well as the measurement results. Every factor that may influence the measurement result must be taken into account. The uncertainty associated with each of these factors also needs to be estimated. Generally, there are two possible sources of uncertainty or error: the measuring equipment and the person operating it.
Gigahertz Solutions calculates the maximum measurement uncertainty at +/-3dB which means the measurement result can be up to 100% above the measured value or 50% below. This is the worst case scenario and must be taken into account. This may seem high, but it is one of the best uncertainty values for standard RF test equipment on the market today.
For more information or products, please contact the authors listed below:
Peter Sierck,
Director/Industrial Hygienist
1106 Second Street, Suite 102 ▲ Encinitas, CA 92024 USA
760-804-9400 Office ▲ 760-942-9400 Direct Line ▲ 760-519-2271 Cellular
Email: psierck@etandt.com
Website: www.EMFRF.com——————————————————————————————————————————
Rob Metzinger,
Electronics Engineering Technologist, BBEC
Gigahertz Solutions North American Importer / Technical Support / Equipment Warranty Provider
President
Safe Living Technologies Inc.
7 Clair Road West, PO Box 27051
Guelph On, N1L0A0
Canada
Tel: (519) 240-8735
Email: rob@slt.co
Website: www.slt.co
Links: EMF Meters / RF Meters
Read the full story at: http://www.emfrf.com/smart-meter-measurement-protocol/
No comments:
Post a Comment